Hands up who loves a nice detailed report? No? Well, we love ′em and here’s why you should too.
Last month we shared some advice for using business intelligence (BI) to be more customer-centric in your contact center. Today we’re going to give you some practical advice on how to use the reporting feature in Zailab solution to gain this valuable BI.
Naturally, you need to be actively using our Zailab platform in order to access this data, but even if you’re not currently using our system, don’t run away. You might find a nugget or two of advice you can utilize in your business anyway.
We’re going to use the team-leader dashboard as our jumping board, but other roles such as administrator, campaign manager and QA manager can also access reports from their unique dashboards.
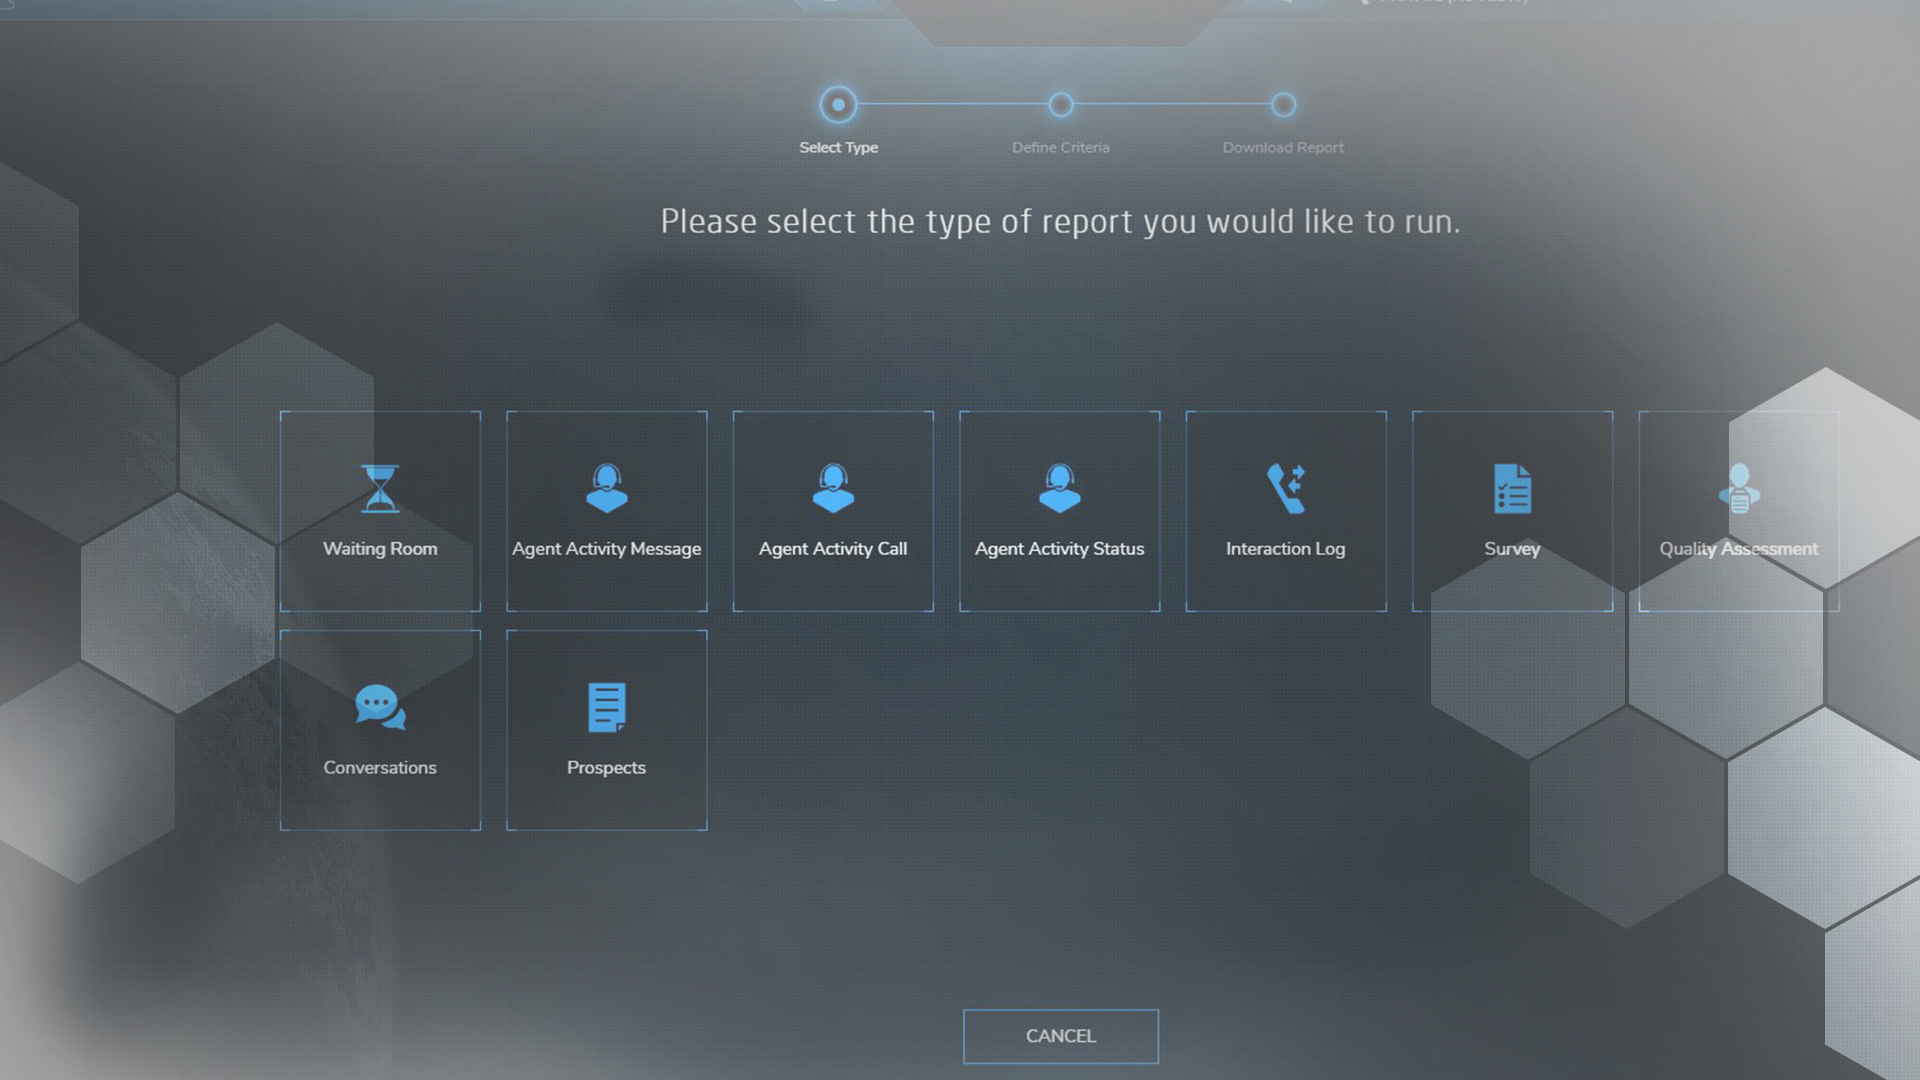
Right. So here are the reports you can access:
- waiting room
- agent activity reports (3)
- interaction log
- survey
- quality assessment
- conversations
- prospects
Depending on how urgently you need this information, you can pull these reports daily or monthly, as well as per team or per agent.
With these reports you will be able to delve deeply into the goings-on of your contact center and be able to determine where the bulk of your agents’ time is spent; how well they’re performing; what work they’re handling; how many calls are coming in and how quickly they’re handled; and most importantly, how your customers feel about the service they’re receiving.
Let’s take a closer look at the reports, shall we?
Waiting room report
This report gives you an overview of your waiting room stats such as average talk time, total calls answered, percentage of abandoned calls, longest waiting call and average waiting time.
This type of information is crucial to your understanding of how your team handles calls and gives you an idea of how your customers are experiencing your business from the outset.
Agent activity reports
The three types of agent activity report give you a birds’-eye view of what your agents are doing, and allow you pinpoint any potential problems that need to be addressed. Again, you can view individual agent reports or team reports.
1. Agent activity message
This looks at the volumes and handle times of the messages – such as emails and SMSes – your agents are sending.
2. Agent activity call
This report shows you how many calls your agents have answered, their average talk time and wrap up time as well as performance metrics such as number of transferred and missed calls, successful and unsuccessful calls and customer ratings.
3. Agent activity status
Here you will see how much time your agents spend on calls, waiting for calls, not responding, on break or away at training or meetings.
Interaction log
This report gives you a detailed breakdown of the inbound and outbound work items that have been handled by your agents. These interactions are broken down into type, channel and service. You will also see which agents handled these interactions and what the outcome and customer survey result was.
Survey report
This report will show you how customers have responded to your agent-rating and general surveys. This is basically first-hand accounts from the source about how your customers experience your business. In other words: gold.
Quality assessment report
This data will give you an overview of how your agents are performing from a QA perspective, as well as a detailed breakdown of their individual scores.
Conversations report
The conversations report gives you a detailed overview of your dealings with customers at a conversation level and details which conversations were successful, unsuccessful or pending. It also shows which agents handled a conversation and how often.
Prospects report
The prospects report shows you how on-target your prospect lists are on a campaign level. It lets you drill down into the quality of the lists to see whether you’re reaching the right people – or reaching anybody at all, for that matter. This is immensely helpful in diagnosing issues with third-party lead lists, as you might imagine.
To access reports, simply navigate to your dashboard and click Reports. Then choose the type of report you want to access. It literally takes a second to download your CSV report.
It’s that easy.
We can only imagine how excited you must be to have all this juicy data at your disposal. By analyzing the information inside these reports you will be able to make sound data-driven decisions to improve the efficiency of your business and take steps to craft a customer experience you can be proud of.
Want to read more about our solution? Here’s how our routing algorithm works under the hood.